Roughly 15 percent of the state’s population is age 60 and older. Further, workers age 55 and older make up 17 percent of the labor force. As the population “greys”, the economic importance of older Utahns will naturally become of greater importance. The Deseret News recently reported that in 2015 there were 337 people in Utah over the age of 100. In 50 years, there will be nearly 7,000.
As an example of the information available and the potential for insights, this post will focus on Carbon County.
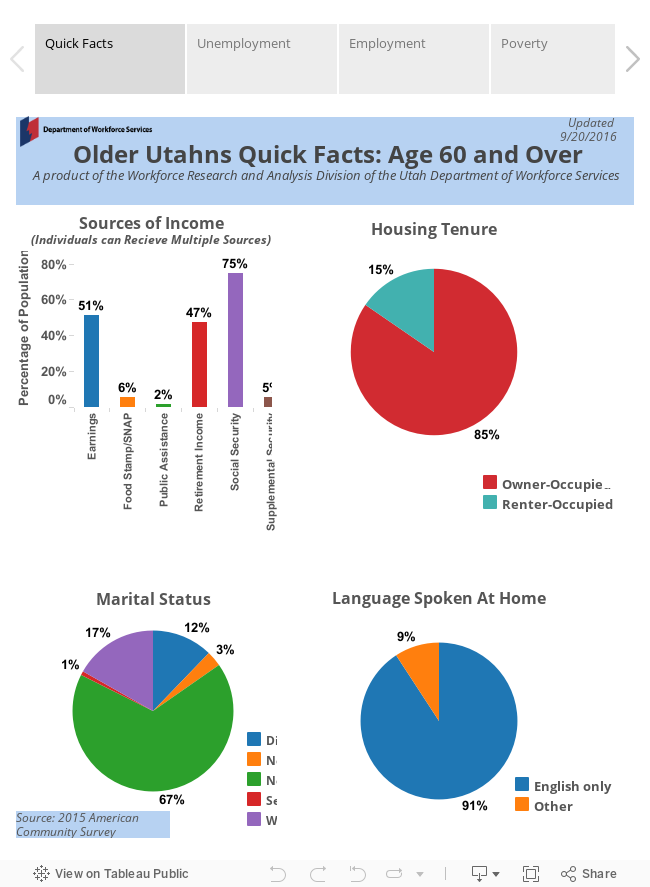
The visualization has six profile segmentations, each represented by a “tab” above the graphs that one can click on. The first tab is a statewide overview of Utahns age 60 and older. From this the reader can generalize that about half of older Utahns still receive taxable income (either passive or active) and/or retirement income. Around 5 percent qualify for some form of public assistance. The typical older Utahn owns his or her home, is married, and speaks English.
The second tab shows unemployment rates by county and age. Older working age Carbon County residents under age 65 have the same unemployment rate as their statewide counterparts. Unemployment is statistically zero in the ages 65-74 cohort and then balloons in the age 75 and older cohort. The last two rates are generated from a very small sample and should be ignored.
Tab three shows the complete employment status of the older population. With the exception of women in the ages 55-59 cohort, county participation rates are markedly lower than the state as a whole. This is a different pattern than that found in other eastern Utah counties; participation rates for men in the ages 55-59 cohort are usually higher than the statewide number. This may be due to problems associated with the coal mining industry.
The fourth tab shows the older population sorted by poverty level, which is $11,670 for an individual. Poverty is much more common in the county than it is statewide. This is especially true for residents in the ages 55-64 cohort. The rates of poverty are closer to the statewide statistics for older cohorts. This is likely because these individuals qualify for social security. As expected, the proportion of residents at the highest end of the scale (more than 400 percent of poverty or $46,680) are less in the county than statewide.
The fifth tab displays insurance coverage differentiated by educational attainment for older Utahns. Note that there is no display for persons without coverage; due to Medicare, that number is statistically zero for both Carbon County and the state as a whole for persons over age 65. The proportion of county residents with private health coverage is roughly the same as the statewide rate. However, the educational attainment of those residents is much lower than the statewide profile. Analysts speculate that these persons probably are beneficiaries of union health plans. This is unique for Utah. In general, private insurance coverage correlates with education.
The sixth and final tab shows disability rates for older Utahns. Disability rates for Carbon County residents of both sexes are markedly higher than are the rates for older Utahns statewide. Given the absence of substantial medical infrastructure, one may assume that disabled county residents would leave the area and therefore lower the disability rate. This is the experience of other eastern Utah counties. However, Carbon County residents are sufficiently close to the medical infrastructure in Utah County and presumably commute.