By Lyndsey Stram, Regional Economist; Lecia Parks Langston, Senior Economist
A product of the Workforce Research and Analysis Division of the Utah Department of Workforce Services
Showing posts with label Carbon County. Show all posts
Tuesday, June 2, 2020
Unemployment Insurance Claims Data Shed Light on the Local Economic Impacts of COVID-19 Public Health Directives
In the wake of the COVID-19 pandemic, businesses lost revenues and workers lost jobs. But because of the time it takes to collect and collate data, economists have been left without much information to quantify the economic impacts at the local level.
But there is one ray of data illumination. Claims for unemployment benefits are promptly available and provide information about a large cross section of the economy. This post will outline what light unemployment claims data sheds on the state of the Castle Country Region’s economy.
While not all workers are protected by unemployment insurance laws, roughly 95% of jobs are covered. This makes claims data an exceptional source of information about the economy. Not included under unemployment insurance laws are most self-employed workers, about half of agricultural employment, unpaid family workers, railroad personnel (covered separately) and many nonprofit organizations (such as churches). Also, some out-of-work employees may not have worked a sufficient work history to qualify for unemployment insurance benefits, but may file anyway.
Fortunately, in this time of economic distress, the social safety nets of the unemployment insurance program, special national COVID-19 funding and social programs are working together to keep workers’ income and well-being stable.
Unemployment claimants and the unemployed; they aren’t the same
Also, keep in mind that, in addition to individuals drawing unemployment benefits, the unemployment rate includes those entering and re-entering the workforce and non-covered groups without current employment. This means the number of “unemployed” will be greater than the number of claimants. In “normal” times, only about 40% of the “unemployed” are claiming benefits.
The generally reported unemployment rate also has a work-search requirement. If you haven’t made any minimal attempts to find work, you aren’t counted as “unemployed.”
Watch this Space
While this analysis won’t be updated on a regular basis, new data will be added to the data visualization on a weekly basis allowing readers to check back for the latest information.
An Unprecedented Event
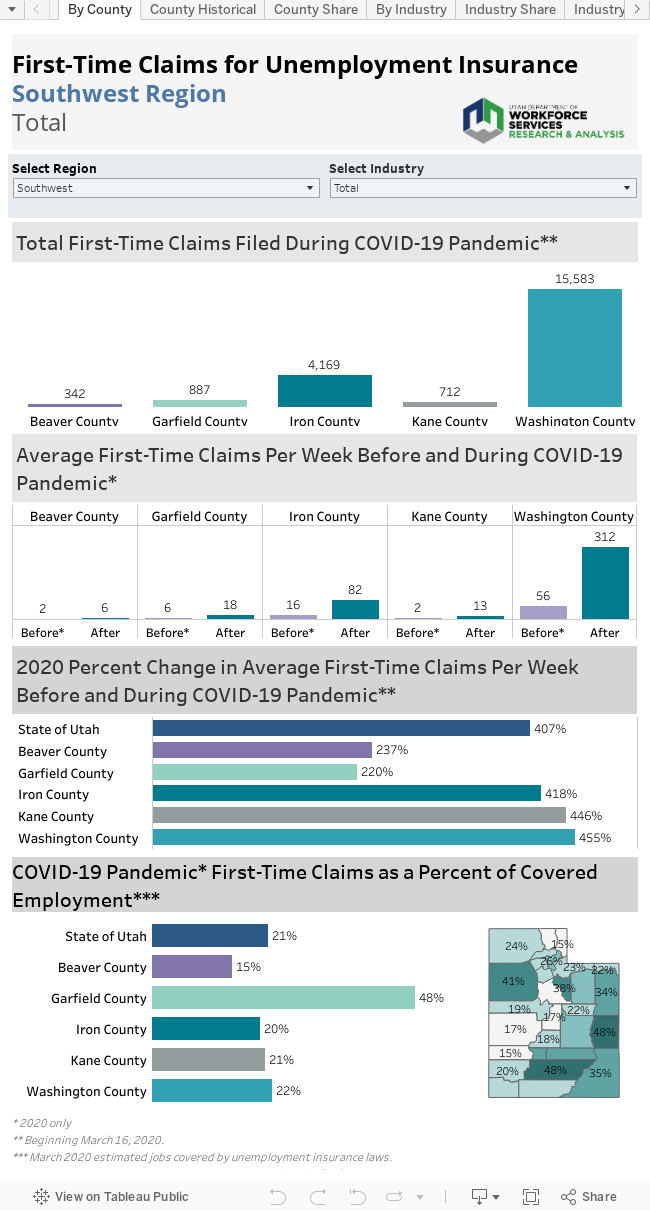
Not surprisingly, first-time claims for unemployment benefits soared in Utah and across the nation as the pandemic swept across the country. This increase is unprecedented since the creation of unemployment insurance coverage during the Great Depression. Week 12 (beginning March 16) marks the start of this unparalleled surge in claims. On a positive note, while new claims for unemployment benefits have skyrocketed in Utah, the state currently shows one of the lowest claims rates in the nation.
Emery County saw its peak in first-time claims in week 13 and Carbon County saw its peak in week 14, the first and second weeks after the COVID-19 pandemic hit. Both counties have seen initial claims drop sharply since then. Carbon County, however, did have another uptick in week 19. Both of the Castle Country counties are now down to initial claims levels comparable to those that occurred in 2009 during the Great Recession.
Who took the hardest hit?
The largest industry shares of initial claims filed in the region belonged to healthcare/social assistance. Tourism is the industry suffering the most right now in many areas and accommodation/food service claims also account for over 15% in the region.
In the initial weeks of the pandemic, many claims (135, or 15% in Castle Country) were filed in unknown industry. Most likely many of these can be accounted for by the healthcare/social assistance and accommodation/food services sectors.
Tourism and COVID-19
Especially in the early stages of the restrictions, this is a story of tourism-dependent industries. Approximately 16% of COVID-19 initial claims filed in Castle Country represented workers previously employed accommodations and food services. In Carbon County, 14% of the total claims, and 21% of the claims in Emery County, belong to the accommodation/food service sector.
Industry Flow
While most of the high-claim industries felt the pain of the pandemic early on, other industries surged in later weeks. As the economic effects of other closures worked their way through the economy, wholesale trade proved to be a latecomer to the layoffs in Castle Country, partially responsible for the spike in claims in week 19.
The High and Low
Although healthcare/social assistance and accommodations/food services have generated the largest number of claims in the region during the COVID-19 time period, in percentage terms, other industries have suffered more. For example, 38% of the administrative support/waste management/remediation workforce (which includes temporary employment firms) have filed a claim for unemployment benefits. More than 20% of both the real estate/rental/leasing and management of companies sectors have filed for benefits, as well.
Other industries have been able to hold on to larger shares of their workforces. Construction has seen extremely low filing percentages, as well as manufacturing. Surprisingly, retail trade in Castle
Country also accounts for a small portion of the claims. This is likely due to a large share of the retail trade in rural areas being deemed “essential” and allowed to remain open.
County by County
Carbon County
• Prior to the COVID-19 pandemic, Carbon County averaged 10 first-time claims per week, this has now increased to 86.
• First-time claimants, as a share of covered employment in Carbon County, has remained lower than the state average at 8%.
• A majority of the claims filed in Carbon County belong to the healthcare/social assistance sector as elective medical services were halted during the peak of COVID-19 concerns in the area.
• Before the COVID-19 pandemic, Carbon County accounted for 63% of the initial claims for unemployment in the region. It accounted for 75% during the pandemic.
Emery County
• Prior to the COVID-19 pandemic, Emery County averaged six first-time claims per week and has increased to 28 on average in the weeks since.
• First-time claimants, as a share of covered employment in Emery County, has remained lower than the state average at 7%.
• Like much of the state, the majority of the claims in Emery County belong to the accommodation/food services and healthcare/social assistance sectors.
• Before the COVID-19 pandemic, Emery County accounted for 37% of the initial claims for unemployment in the region. It accounted for 25% during the pandemic.
But there is one ray of data illumination. Claims for unemployment benefits are promptly available and provide information about a large cross section of the economy. This post will outline what light unemployment claims data sheds on the state of the Castle Country Region’s economy.
While not all workers are protected by unemployment insurance laws, roughly 95% of jobs are covered. This makes claims data an exceptional source of information about the economy. Not included under unemployment insurance laws are most self-employed workers, about half of agricultural employment, unpaid family workers, railroad personnel (covered separately) and many nonprofit organizations (such as churches). Also, some out-of-work employees may not have worked a sufficient work history to qualify for unemployment insurance benefits, but may file anyway.
Fortunately, in this time of economic distress, the social safety nets of the unemployment insurance program, special national COVID-19 funding and social programs are working together to keep workers’ income and well-being stable.
Unemployment claimants and the unemployed; they aren’t the same
Also, keep in mind that, in addition to individuals drawing unemployment benefits, the unemployment rate includes those entering and re-entering the workforce and non-covered groups without current employment. This means the number of “unemployed” will be greater than the number of claimants. In “normal” times, only about 40% of the “unemployed” are claiming benefits.
The generally reported unemployment rate also has a work-search requirement. If you haven’t made any minimal attempts to find work, you aren’t counted as “unemployed.”
Watch this Space
While this analysis won’t be updated on a regular basis, new data will be added to the data visualization on a weekly basis allowing readers to check back for the latest information.
An Unprecedented Event
Not surprisingly, first-time claims for unemployment benefits soared in Utah and across the nation as the pandemic swept across the country. This increase is unprecedented since the creation of unemployment insurance coverage during the Great Depression. Week 12 (beginning March 16) marks the start of this unparalleled surge in claims. On a positive note, while new claims for unemployment benefits have skyrocketed in Utah, the state currently shows one of the lowest claims rates in the nation.
Emery County saw its peak in first-time claims in week 13 and Carbon County saw its peak in week 14, the first and second weeks after the COVID-19 pandemic hit. Both counties have seen initial claims drop sharply since then. Carbon County, however, did have another uptick in week 19. Both of the Castle Country counties are now down to initial claims levels comparable to those that occurred in 2009 during the Great Recession.
Who took the hardest hit?
The largest industry shares of initial claims filed in the region belonged to healthcare/social assistance. Tourism is the industry suffering the most right now in many areas and accommodation/food service claims also account for over 15% in the region.
In the initial weeks of the pandemic, many claims (135, or 15% in Castle Country) were filed in unknown industry. Most likely many of these can be accounted for by the healthcare/social assistance and accommodation/food services sectors.
Tourism and COVID-19
Especially in the early stages of the restrictions, this is a story of tourism-dependent industries. Approximately 16% of COVID-19 initial claims filed in Castle Country represented workers previously employed accommodations and food services. In Carbon County, 14% of the total claims, and 21% of the claims in Emery County, belong to the accommodation/food service sector.
Industry Flow
While most of the high-claim industries felt the pain of the pandemic early on, other industries surged in later weeks. As the economic effects of other closures worked their way through the economy, wholesale trade proved to be a latecomer to the layoffs in Castle Country, partially responsible for the spike in claims in week 19.
The High and Low
Although healthcare/social assistance and accommodations/food services have generated the largest number of claims in the region during the COVID-19 time period, in percentage terms, other industries have suffered more. For example, 38% of the administrative support/waste management/remediation workforce (which includes temporary employment firms) have filed a claim for unemployment benefits. More than 20% of both the real estate/rental/leasing and management of companies sectors have filed for benefits, as well.
Other industries have been able to hold on to larger shares of their workforces. Construction has seen extremely low filing percentages, as well as manufacturing. Surprisingly, retail trade in Castle
Country also accounts for a small portion of the claims. This is likely due to a large share of the retail trade in rural areas being deemed “essential” and allowed to remain open.
County by County
Carbon County
• Prior to the COVID-19 pandemic, Carbon County averaged 10 first-time claims per week, this has now increased to 86.
• First-time claimants, as a share of covered employment in Carbon County, has remained lower than the state average at 8%.
• A majority of the claims filed in Carbon County belong to the healthcare/social assistance sector as elective medical services were halted during the peak of COVID-19 concerns in the area.
• Before the COVID-19 pandemic, Carbon County accounted for 63% of the initial claims for unemployment in the region. It accounted for 75% during the pandemic.
Emery County
• Prior to the COVID-19 pandemic, Emery County averaged six first-time claims per week and has increased to 28 on average in the weeks since.
• First-time claimants, as a share of covered employment in Emery County, has remained lower than the state average at 7%.
• Like much of the state, the majority of the claims in Emery County belong to the accommodation/food services and healthcare/social assistance sectors.
• Before the COVID-19 pandemic, Emery County accounted for 37% of the initial claims for unemployment in the region. It accounted for 25% during the pandemic.
Monday, March 5, 2018
Utah's Seasonally Adjusted Unemployment Rates
Seasonally adjusted unemployment rates for all Utah counties have been posted online here.
Each month, these rates are posted the Monday following the Unemployment Rate Update for Utah.
For more information about seasonally adjusted rates, read a DWS analysis here.
Next update scheduled for March 26th.
Each month, these rates are posted the Monday following the Unemployment Rate Update for Utah.
For more information about seasonally adjusted rates, read a DWS analysis here.
Next update scheduled for March 26th.
Friday, March 2, 2018
Utah's Employment Situation for January 2018
Utah's Employment Situation for January 2018 has been released on the web.
Find the Current Economic Situation in its entirety here.
For charts and tables, including County Employment, go to the Employment and Unemployment page.
Next update scheduled for March 23rd, 2018.
Find the Current Economic Situation in its entirety here.
For charts and tables, including County Employment, go to the Employment and Unemployment page.
Next update scheduled for March 23rd, 2018.
Friday, January 29, 2016
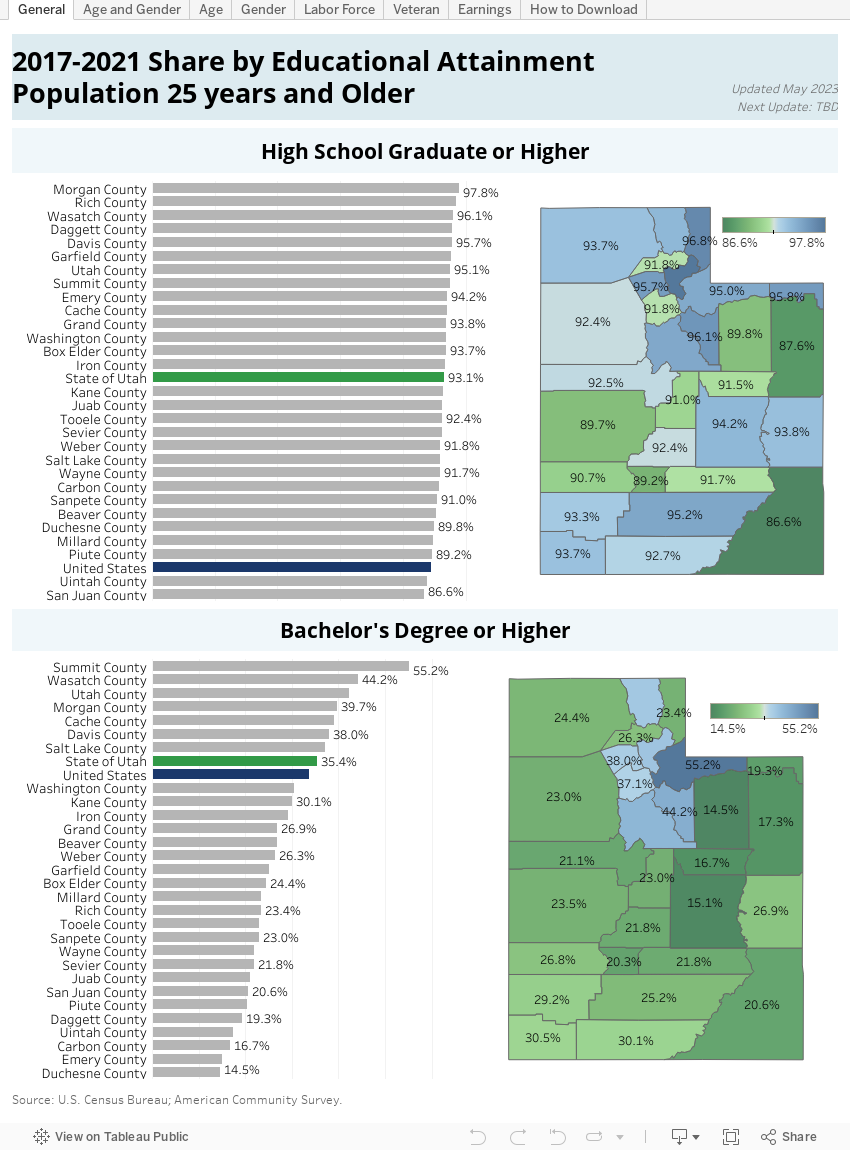
Educational Attainment and Castle Country
Scott Smith, Regional Economist
The ACS offers insights how the country’s workers of varying
educational attainment are distributed and how they are compensated.
As a point of reference, on average, U.S. workers who
possess less than a high school diploma earn $19,954. High school graduates
earn $27,868. Workers who have earned an associate’s degree or attended college
earn $33,988. College graduates earn $50,515. Recipients of graduate degrees earn
$66,944.
Nationally, men make more than women. For example, women
earn between 32 and 34 percent less than males with equivalent educational
background. Some, but not all, of this difference can be explained by a
significant proportion of women who choose part-time employment.
The ACS also maps the composition of the labor force by
highest educational attainment. Nationally, roughly 12 percent of the 25-year-and-older
population has not graduated from high school. Almost 27 percent of the
population has a high school diploma while 31 percent has advanced to an associate’s
degree or has attended university. A little more than 30 percent has a bachelor’s
degree.
What follows is a comparison of the population of the
counties in the Castle Country against the national statistics.
Carbon County
On average, Carbon County residents 25 years and older who
possess less than a high school diploma earn $21,726. High school graduates
earn $29,063. Workers who earned an associate’s degree or attended college
earned $29,136. College graduates earn $37,986, while recipients of
professional/graduate degrees make $54,704.
Carbon County workers earn 85 percent of the U.S. median.
Sorting by gender yields the statistic that Carbon County women earn 43 percent
of men’s wages, while the analogous U.S. figure is 72 percent. Women with less
educational attainment influence this figure. Women with no high school degree
earn 22 percent, 42 percent for high school graduates and 37 percent for associate’s
degrees.
High school graduates in Carbon County earn 104 percent of
the U.S. median for both sexes. Men earn 124 percent of the U.S. median for men,
while women earn only 78 percent of their respective median. Carbon County
residents who hold an associate’s degree or have attended college make 86
percent of the U.S. median. Men earn 122 percent of the U.S. median for men,
while women earn 65 percent of the U.S. median for women. College graduates in
Carbon County make 75 percent of the U.S. median for both sexes. Men earn 89
percent, while women earn 80 percent. Recipients of graduate degrees earn 82
percent of the U.S. median. Men make 87 percent of the median for men, while
women make 91 percent their respective median.
Carbon County residents differ from the national profile by
educational attainment. Almost 48 percent of the population hold an associate’s
degree or have attended college. In contrast, only 31 percent of the U.S.
population has the same level of attainment. Conversely, only 13 percent of the
county labor force holds at least a bachelor’s degree. The analogous figure for
the U.S. is 31 percent.
Emery County
Emery County residents who possess less than a high school
diploma earn on average $18,068. High school graduates earn $31,123. Workers
who earned an associate’s degree or attended college earn $32,891. College
graduates earn $45,625, while recipients of professional/graduate degrees make $45,682.
In total, women earn 35 percent of men’s wages, while the
analogous U.S. figure is 72 percent. Only women with graduate degrees approach
the national median. Emery County women with no high school diploma earn 34 percent,
41 percent for high school graduates and 28 percent for women with associate’s
degrees. Women with bachelor’s degrees earn 49 percent of the male counterparts’
income.
The effects of mining employment are apparent in the income by
gender statistics. Emery County workers make 94 percent of the U.S. aggregate
median. Workers with less than a high school education earn 91 percent of the
aggregate median. Men earn a 123 percent of the U.S. median for men, while
women earn 62 percent of the U.S. median for women. Emery County high school
graduates earn 112 percent of the U.S. median for both sexes. Men earn 127
percent of the U.S. median for men, while women earn only 78 percent of their
respective median. Emery County residents who hold an associate’s degree or
have attended college make 97 percent of the U.S. median. Men earn 125 percent
of the U.S. median for men, while women earn 50 percent of the U.S. median for
women. College graduates in Emery County make 90 percent of the U.S. median for
both sexes. Men earn 92 percent, while women earn 65 percent. Recipients of
graduate degrees earn 68 percent of the U.S. median. Men make 73 percent of the
median for men while women make 72 percent their respective median.
Emery County residents differ from the national profile by
educational attainment. Almost 48 percent of the population hold an associate’s
degree or have attended college. In contrast, only 31 percent of the U.S.
population has the same level of attainment. Conversely, only 11 percent of the
county labor force holds at least a bachelor’s degree. The analogous figure for
the U.S. is 31 percent.
Wednesday, November 4, 2015
Reviewing the 2012 Agricultural Census for Castle Country
<
Scott Smith, Regional Economist
The 2012 Census of Agriculture is just that — a census. It is an attempt to count an entire population and generally does not use sampling or statistical techniques to make conclusions. It is conducted every five years and includes all farm operators regardless of whether farming is their primary or secondary occupation. Operators and hired laborers are combined for a total count. There can be a maximum of three operators per farm, but labor hired on a contract basis is not covered.
Castle Country agriculture is focused on the production of livestock and associated feedstock. Almost 90 percent of Carbon County agricultural land is classified as pasture and rangeland. Emery County is a bit different. It is just over 50 percent pasture and rangeland, and 26 percent cropland. The remainder is woodland and other. 2012 net cash income per farm for the two counties was $1.4 million and $140,000 respectively. The bulk of the region’s farms have total annual sales of less than $250,000.
Castle Country farm employment in the 2012 census was 1,944. As noted above, the census counts workers whose primary and secondary source of income is agriculture. Additional data sources reveal that the vast majority of the Castle Country farm workforce has primary jobs outside of agriculture. The size and composition of the agricultural workforce has changed markedly over time. In 2002, the total labor force was 1,732 of which 37 percent was hired labor. The total agricultural workforce increased by 11 percent by 2007 to 1,914, but the number of hired laborers actually declined to 29 percent. The analogous figures for 2012 are 2 percent and 24 percent.
There is an obvious trend away from hired employment. The reason for this can be gleaned from expense data. In 2002, the labor cost per worker (as defined by dividing annual labor expense by the hired workforce) was $2,690. In 2007, the cost had risen 27 percent to $3,320. In 2012, this number had increased by 21 percent to $4,140. In contrast, inflation increased by 15 percent and 9 percent respectively, as of the 2007 and 2012 censuses. Faced with higher real (inflation adjusted) labor costs, operators appear to have substituted to their own labor or made investments in capital goods.
The number and character of Castle Country operators has displayed an interesting combination of volatility and adherence to the trend. There were 724 principal operators in the Castle Country in 2002 (the statistics refer to “principal” operator and therefore will not agree with other totals). The number of operators increased by 23 percent to 887 operators in 2007, and then remained essentially unchanged as of the 2012 count. Similarly, in 2007, the proportion of operators who rely on other sources of income shot up to 68 percent from 55 percent in 2002. The share returned to 55 percent in the 2012 census.
Analysts speculate that the changes are in response to fluctuations in farm income. In 2002, net cash income per operator was $2,887. Operators suffered a loss of $484 in 2007, and generated a gain of only $345 in 2012. Farming takes some capital investment, and the proprietorship of an ongoing enterprise is somewhat “sticky” — operators are loath to walk away from their investments. Presumably, the large gains generated in 2002 attracted market participants who stayed around to experience a loss in 2007. That loss and the rather meager gain generated in 2012 were insufficient to attract any more participants into the industry. Similarly, the losses generated in 2007 made it necessary for some operators to seek other sources of income. The small gain of 2012 was sufficient to reduce the share of “full time” operators back to its historic norm.
Scott Smith, Regional Economist
The 2012 Census of Agriculture is just that — a census. It is an attempt to count an entire population and generally does not use sampling or statistical techniques to make conclusions. It is conducted every five years and includes all farm operators regardless of whether farming is their primary or secondary occupation. Operators and hired laborers are combined for a total count. There can be a maximum of three operators per farm, but labor hired on a contract basis is not covered.
Castle Country agriculture is focused on the production of livestock and associated feedstock. Almost 90 percent of Carbon County agricultural land is classified as pasture and rangeland. Emery County is a bit different. It is just over 50 percent pasture and rangeland, and 26 percent cropland. The remainder is woodland and other. 2012 net cash income per farm for the two counties was $1.4 million and $140,000 respectively. The bulk of the region’s farms have total annual sales of less than $250,000.
Castle Country farm employment in the 2012 census was 1,944. As noted above, the census counts workers whose primary and secondary source of income is agriculture. Additional data sources reveal that the vast majority of the Castle Country farm workforce has primary jobs outside of agriculture. The size and composition of the agricultural workforce has changed markedly over time. In 2002, the total labor force was 1,732 of which 37 percent was hired labor. The total agricultural workforce increased by 11 percent by 2007 to 1,914, but the number of hired laborers actually declined to 29 percent. The analogous figures for 2012 are 2 percent and 24 percent.
There is an obvious trend away from hired employment. The reason for this can be gleaned from expense data. In 2002, the labor cost per worker (as defined by dividing annual labor expense by the hired workforce) was $2,690. In 2007, the cost had risen 27 percent to $3,320. In 2012, this number had increased by 21 percent to $4,140. In contrast, inflation increased by 15 percent and 9 percent respectively, as of the 2007 and 2012 censuses. Faced with higher real (inflation adjusted) labor costs, operators appear to have substituted to their own labor or made investments in capital goods.
The number and character of Castle Country operators has displayed an interesting combination of volatility and adherence to the trend. There were 724 principal operators in the Castle Country in 2002 (the statistics refer to “principal” operator and therefore will not agree with other totals). The number of operators increased by 23 percent to 887 operators in 2007, and then remained essentially unchanged as of the 2012 count. Similarly, in 2007, the proportion of operators who rely on other sources of income shot up to 68 percent from 55 percent in 2002. The share returned to 55 percent in the 2012 census.
Analysts speculate that the changes are in response to fluctuations in farm income. In 2002, net cash income per operator was $2,887. Operators suffered a loss of $484 in 2007, and generated a gain of only $345 in 2012. Farming takes some capital investment, and the proprietorship of an ongoing enterprise is somewhat “sticky” — operators are loath to walk away from their investments. Presumably, the large gains generated in 2002 attracted market participants who stayed around to experience a loss in 2007. That loss and the rather meager gain generated in 2012 were insufficient to attract any more participants into the industry. Similarly, the losses generated in 2007 made it necessary for some operators to seek other sources of income. The small gain of 2012 was sufficient to reduce the share of “full time” operators back to its historic norm.
Monday, August 3, 2015
Local Insights and Utah Insights updated on the Web
By Mark Knold, Supervising Economist
Shelter is one of humanity’s basic needs. That is why housing is everywhere. Since housing is so ubiquitous, it becomes an important component in an economy’s foundation, and as such becomes an economic indicator.
In this issue of Local Insights, we look at the demand for housing structures, the amount of housing permits and their history, and how this history shows that housing demand follows the ups and downs of a region’s economic performance. In evaluating the volume of housing permits, we also parallel the health and vitality of the local economy.
People need jobs that supply them income in order to afford housing. Jobs are not the only factor, as things like affordability and the ability to obtain lending also play their part in housing demand. But the foundation of housing demand is the health of the job market.
The graph shows Utah statewide housing permits. A trend of normal permitting activity is evident from 1996 through 2004. Permits rose during the pre-Great Recession boom, then became lethargic for the seven years following. It is just recently that the volume of permit activity is again approaching something normal. That in itself is an economic indicator of an improved Utah economy.
--------------------------------------------
To read more, see the latest issues of Local Insights. To receive a printed copy, please call 801-526-9785.
Shelter is one of humanity’s basic needs. That is why housing is everywhere. Since housing is so ubiquitous, it becomes an important component in an economy’s foundation, and as such becomes an economic indicator.
In this issue of Local Insights, we look at the demand for housing structures, the amount of housing permits and their history, and how this history shows that housing demand follows the ups and downs of a region’s economic performance. In evaluating the volume of housing permits, we also parallel the health and vitality of the local economy.
People need jobs that supply them income in order to afford housing. Jobs are not the only factor, as things like affordability and the ability to obtain lending also play their part in housing demand. But the foundation of housing demand is the health of the job market.
The graph shows Utah statewide housing permits. A trend of normal permitting activity is evident from 1996 through 2004. Permits rose during the pre-Great Recession boom, then became lethargic for the seven years following. It is just recently that the volume of permit activity is again approaching something normal. That in itself is an economic indicator of an improved Utah economy.
--------------------------------------------
To read more, see the latest issues of Local Insights. To receive a printed copy, please call 801-526-9785.
Subscribe to:
Posts (Atom)